?In Problems 9–12, determine whether the scatter diagram indicates that a linear relation may exist between the two variables. If the relation is linea
Chapter 4, Problem 10(choose chapter or problem)
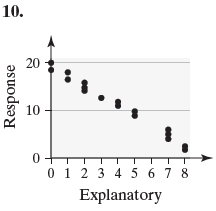
In Problems 9–12, determine whether the scatter diagram indicates that a linear relation may exist between the two variables. If the relation is linear, determine whether it indicates a positive or negative association between the variables.
Unfortunately, we don't have that question answered yet. But you can get it answered in just 5 hours by Logging in or Becoming a subscriber.
Becoming a subscriber
Or look for another answer