?Hurricanes The data in the next column represent the maximum wind speed (in knots) and atmospheric pressure (in millibars) for a random sample of hurr
Chapter 4, Problem 30(choose chapter or problem)
Hurricanes The data in the next column represent the maximum wind speed (in knots) and atmospheric pressure (in millibars) for a random sample of hurricanes that originated in the Atlantic Ocean.
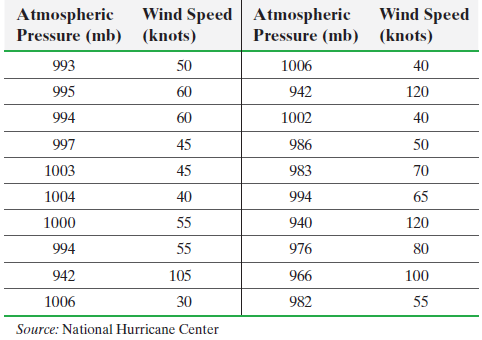
(a) Draw a scatter diagram treating atmospheric pressure as the explanatory variable.
(b) Compute the linear correlation coefficient between atmospheric pressure and wind speed.
(c) Does a linear relation exist between atmospheric pressure and wind speed?
Unfortunately, we don't have that question answered yet. But you can get it answered in just 5 hours by Logging in or Becoming a subscriber.
Becoming a subscriber
Or look for another answer