?Draw Your Data! Consider the four data sets shown below. (a) Compute the linear correlation coefficient for each data set. (b)
Chapter 4, Problem 37(choose chapter or problem)
Draw Your Data! Consider the four data sets shown below.
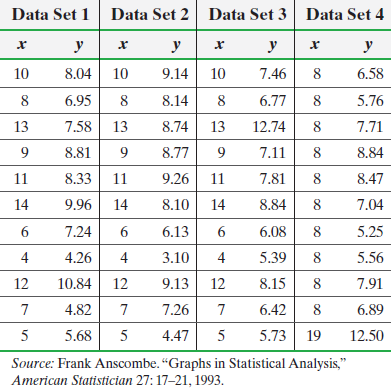
(a) Compute the linear correlation coefficient for each data set.
(b) Draw a scatter diagram for each data set. Conclude that linear correlation coefficients and scatter diagrams must be used together in any statistical analysis of bivariate data.
Unfortunately, we don't have that question answered yet. But you can get it answered in just 5 hours by Logging in or Becoming a subscriber.
Becoming a subscriber
Or look for another answer