?Measuring Reaction Time Researchers wanted to determine whether the reaction time (in seconds) of males differed from that of females to a go/no go st
Chapter 11, Problem 14(choose chapter or problem)
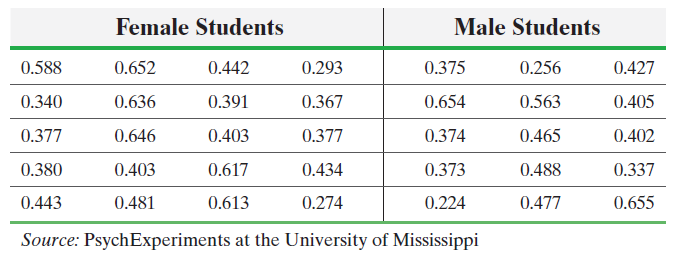
Measuring Reaction Time Researchers wanted to determine whether the reaction time (in seconds) of males differed from that of females to a go/no go stimulus. The researchers randomly selected 20 females and 15 males to participate in the study. The go/no go stimulus required the student to respond to a particular stimulus and not to respond to other stimuli. The results are as follows:
(a) Is it reasonable to use Welch’s t-test? Why? Note: Normal probability plots indicate that the data are approximately normal and boxplots indicate that there are no outliers.
(b) Test whether there is a difference in the reaction times of males and females at the = 0.05 level of significance.
(c) Draw boxplots of each data set using the same scale. Does this visual evidence support the results obtained in part (b)?
Unfortunately, we don't have that question answered yet. But you can get it answered in just 5 hours by Logging in or Becoming a subscriber.
Becoming a subscriber
Or look for another answer