Solution Found!
Local and absolute extreme values Use the following graphs
Chapter 7, Problem 15E(choose chapter or problem)
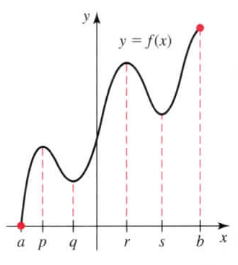
15-18. Local and absolute extreme values Use the following graphs to identify the points on the interval [a, b] at which local and absolute extreme values occur.
Questions & Answers
QUESTION:
15-18. Local and absolute extreme values Use the following graphs to identify the points on the interval [a, b] at which local and absolute extreme values occur.
ANSWER:
STEP_BY_STEP SOLUTION Step_1 When an output value of a function is a maximum or a minimum over the entire domain of the function, the value is called the absolute maximum or the absolute minimum. Let f be a function with domainD and let c be a fixed constant in D. Then the output value f ) is the 1. Absolute maximum value of f on D if and only if f(x) f(c) , for all x in D. 2. Absolute minimum value of f on D if and only if f(c) f(x) , for all x in D. Step-2 Let f be defined on the interval [a,b] , and x be the 0nterior point on [a,b]. A function f has a local maximum or relative maximum at a point x if the values 0 f(x) of f for x ‘near’ x are 0ll less than f(x ). 0 That is , f(x) f(x ) 0 Thus, thegraph of f near x