Solution Found!
The accompanying graph shows the concentration of a
Chapter 13, Problem 119E(choose chapter or problem)
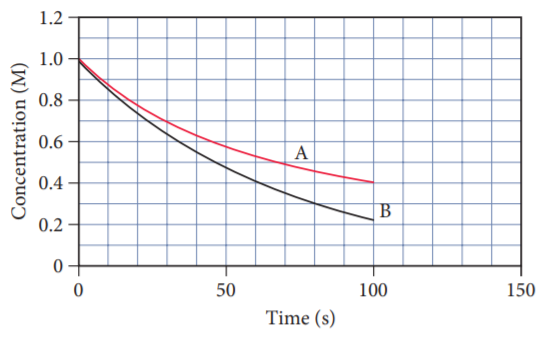
The accompanying graph shows the concentration of a reactant as a function of time for two different reactions. One of the reactions is first order and the other is second order. Which of the two reactions is first order? Second order? How would you change each plot to make it linear?
Questions & Answers
QUESTION:
The accompanying graph shows the concentration of a reactant as a function of time for two different reactions. One of the reactions is first order and the other is second order. Which of the two reactions is first order? Second order? How would you change each plot to make it linear?
ANSWER:
Problem 119EThe accompanying graph shows the concentration of a reactant as a function of timefor two different reactions. One of the reactions is first order and the other is secondorder. Which of the two reactions is first order Second order How would you changeeach plot to make it linear Step by step solutionStep 1 of 4A graph of concentration Vs. time for two different reactions is shown below. One of thereactions is first order and the other is second order. Order of each reaction should be determinedby using an integral method of analysis.