Solution Found!

Figure 2–50 shows the position vs. time graph for two bicycles, A and B. (a) Identify
Chapter 2, Problem 85GP(choose chapter or problem)
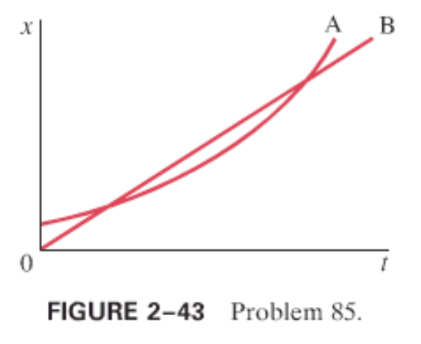
Figure 2–43 shows the position vs. time graph for two bicycles, A and B. (a) i sphere any instant at which the two bicycles have the same velocity. (b) Which bicycle has the larger acceleration? (c) At which instant(s) are the bicycles passing each other? Which bicycle is passing the other? (d) Which bicycle has the larger instantaneous velocity? (e) Which bicycle has the higher average velocity?
Questions & Answers
QUESTION:
Figure 2–43 shows the position vs. time graph for two bicycles, A and B. (a) i sphere any instant at which the two bicycles have the same velocity. (b) Which bicycle has the larger acceleration? (c) At which instant(s) are the bicycles passing each other? Which bicycle is passing the other? (d) Which bicycle has the larger instantaneous velocity? (e) Which bicycle has the higher average velocity?
ANSWER:
Solution 85 GP
Step 1 of 5
a.)
We have to identify the instant at which the two bicycles have the same velocity from the graph of position time for two bicycles.
The position time graph for two bicycles A and B is as shown below,
Now, at the time marked on the graph the instantaneous slopes of the bicycles
graph are the same. Hence, the velocities
Slope of
of the bicycles are the same.
Therefore, at the instant marked on the graph the velocities of the bicycles are the same.
b.)