
The following table of data was analyzed in Quality
Chapter 15, Problem 161E(choose chapter or problem)
The following table of data was analyzed in Quality Engineering [1991–1992, Vol. 4(1)]. The average particle size of raw material was obtained from 25 successive samples.
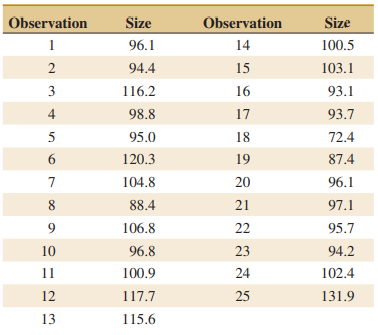
(a) Using all the data, compute trial control limits for individual observations and moving-range charts. Construct the chart and plot the data. Determine whether the process is in statistical control. If not, assume that assignable causes can be found to eliminate these samples and revise the control limits.
(b) Estimate the process mean and standard deviation for the in-control process.
Unfortunately, we don't have that question answered yet. But you can get it answered in just 5 hours by Logging in or Becoming a subscriber.
Becoming a subscriber
Or look for another answer