Solution Found!
Categorical Data. In Exercise, use the given categorical
Chapter 2, Problem 30BSC(choose chapter or problem)
Categorical Data. In Exercises 29–32, use the given categorical data to construct the relative frequency distribution.
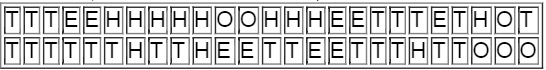
Train Derailments An analysis of 50 train derailment incidents identified the main causes listed below, where T denotes bad track, E denotes faulty equipment, H denotes human error, and O denotes other causes (based on data from the Federal Railroad Administration).
Questions & Answers
QUESTION:
Categorical Data. In Exercises 29–32, use the given categorical data to construct the relative frequency distribution.
Train Derailments An analysis of 50 train derailment incidents identified the main causes listed below, where T denotes bad track, E denotes faulty equipment, H denotes human error, and O denotes other causes (based on data from the Federal Railroad Administration).
ANSWER:
Answer :
Step 1 of 1 :
Given, An analysis of 50 train derailment incidents identified the main causes listed below, where T denotes bad track, E denotes faulty equipment, H denotes human error, and O denotes other causes
That is
Class |
Frequency |
Bad track (T) |
23 |
Faulty equipment (E) |
9 |
Human error (H) |
12 |