Solution Found!
Finding the Best Model. Construct a scatterplot and
Chapter 10, Problem 5 BSC(choose chapter or problem)
Statistical Literacy and Critical Thinking
Finding the Best Model. In Exercises 5–16, construct a scatterplot and identify the mathematical model that best fits the given data. Assume that the model is to be used only for the scope of the given data, and consider only linear, quadratic, logarithmic, exponential, and power models.
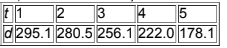
Dropped Object The table lists the distance d (meters) above the ground for an object dropped in a vacuum from a height of 300 m. The time t (in sec) is the time after the object has been released.
Questions & Answers
QUESTION:
Statistical Literacy and Critical Thinking
Finding the Best Model. In Exercises 5–16, construct a scatterplot and identify the mathematical model that best fits the given data. Assume that the model is to be used only for the scope of the given data, and consider only linear, quadratic, logarithmic, exponential, and power models.
Dropped Object The table lists the distance d (meters) above the ground for an object dropped in a vacuum from a height of 300 m. The time t (in sec) is the time after the object has been released.
ANSWER:
Answer:
Step 1 of 1
In Excel draw the scatter plot for t and d.
Right click on any point, click on ‘add trendline’ option.
Click ‘Linear’ and choose ‘display equation on chart’ and ‘R-squared value’.
Follow the same steps for quadratic, logarithmic, exponential, and power models.
Linear
