Solution Found!
The exercises are based on the following sample data
Chapter 10, Problem 10 CQQ(choose chapter or problem)
QUESTION:
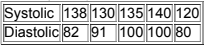
The exercises are based on the following sample data obtained from different secondyear medical students who took blood pressure measurements of the same person (based on data from Marc Triola, MD).
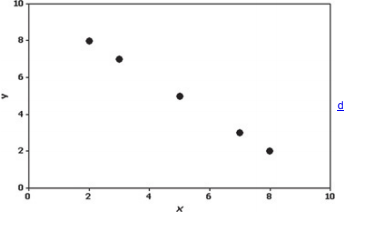
If the sample data were to result in the scatterplot shown here, what is the value of the linear correlation coefficient r?
Questions & Answers
QUESTION:
The exercises are based on the following sample data obtained from different secondyear medical students who took blood pressure measurements of the same person (based on data from Marc Triola, MD).
If the sample data were to result in the scatterplot shown here, what is the value of the linear correlation coefficient r?
ANSWER:
Answer: