Solution Found!
Solved: Rolling the Dice An experiment was conducted in
Chapter 9, Problem 9AYU(choose chapter or problem)
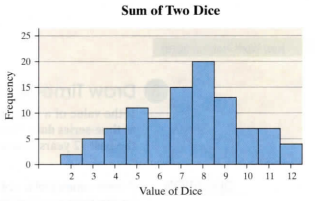
An experiment was conducted in which two fair dice were thrown 100 times. The sum of the pips showing on the dice was then recorded. The following frequency histogram gives the results.
(a) What was the most frequent outcome of the experiment?
(b) What was the least frequent?
(c) How many times did we observe a 7?
(d) How many more 5’s were observed than 4’s?
(e) Determine the percentage of time a 7 was observed.
(f) Describe the shape of the distribution.
Questions & Answers
QUESTION:
An experiment was conducted in which two fair dice were thrown 100 times. The sum of the pips showing on the dice was then recorded. The following frequency histogram gives the results.
(a) What was the most frequent outcome of the experiment?
(b) What was the least frequent?
(c) How many times did we observe a 7?
(d) How many more 5’s were observed than 4’s?
(e) Determine the percentage of time a 7 was observed.
(f) Describe the shape of the distribution.
ANSWER:Step 1 of 2
An experiment was conducted in which two fair dice were thrown 100 times. The sum of the pips showing on the dice was then recorded. The following frequency histogram gives the results.

(a) From the graph, we see 8 is the most frequent outcome of the experiment.
(b) From the graph, we see that 2 is the least frequent.