Solution Found!
Solved: Google, Inc. The following data represent the
Chapter 9, Problem 56AYU(choose chapter or problem)
QUESTION:
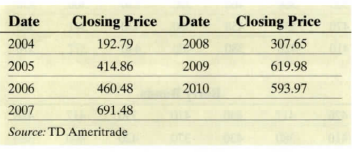
Google, Inc. The following data represent the closing stock price for Google, Inc. at the end of each year since it first went public in 2004 until the end of 2010. Construct a time-series plot and on any trends. What was the percent change in Google stock from 2009 to 2010?
Questions & Answers
QUESTION:
Google, Inc. The following data represent the closing stock price for Google, Inc. at the end of each year since it first went public in 2004 until the end of 2010. Construct a time-series plot and on any trends. What was the percent change in Google stock from 2009 to 2010?
ANSWER: