Solution Found!
Solved: Which of the graphs in Fig. Q25.12 best
Chapter 25, Problem 12DQ(choose chapter or problem)
Problem 12DQ
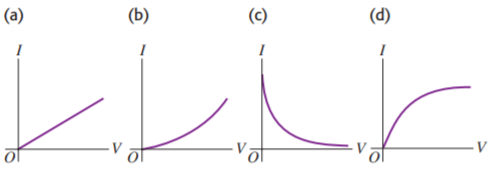
Which of the graphs in Fig. Q25.12 best illustrates the current I in a real resistor as a function of the potential difference V across it? Explain. (Hint: See Discussion Question Q25.11.)
Questions & Answers
QUESTION:
Problem 12DQ
Which of the graphs in Fig. Q25.12 best illustrates the current I in a real resistor as a function of the potential difference V across it? Explain. (Hint: See Discussion Question Q25.11.)
ANSWER:
Solution 12DQ
Step 1 of 2:
In case of resistor with resistance R, the current through the resistor when supplied with the potential difference or voltage V is given by the ohm’s law,
V= I R
Where V is voltage across resistor with resistance R , I is current through resistor.
As resistance of an ideal resistor is constant, R = constant.
Therefore, from above equation, at constant resistance; current depends linearly on the applied voltage.
That is,