Solution Found!
Following are summary statistics for two data sets,A and
Chapter 1, Problem 15E(choose chapter or problem)
Following are summary statistics for two data sets, A and B.
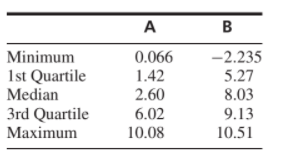
a. Compute the interquartile ranges for both A and B.
b. Do the summary statistics for A provide enough information to construct a boxplot? If so, construct the boxplot. If not, explain why.
c. Do the summary statistics for B provide enough information to construct a boxplot? If so, construct the boxplot. If not, explain why.
Questions & Answers
QUESTION:
Following are summary statistics for two data sets, A and B.
a. Compute the interquartile ranges for both A and B.
b. Do the summary statistics for A provide enough information to construct a boxplot? If so, construct the boxplot. If not, explain why.
c. Do the summary statistics for B provide enough information to construct a boxplot? If so, construct the boxplot. If not, explain why.
ANSWER: