Solution Found!
Fast cars Interested in a sporty car Worried that it might
Chapter 4, Problem 4.6(choose chapter or problem)
Fast cars Interested in a sporty car? Worried that it might use too much gas? The Environmental Protection Agency lists most such vehicles in its minicompact or two-seater categories. Table 4.1 gives city and highway gas mileages (in miles per gallon) for all model year 2009 cars in these two groups.
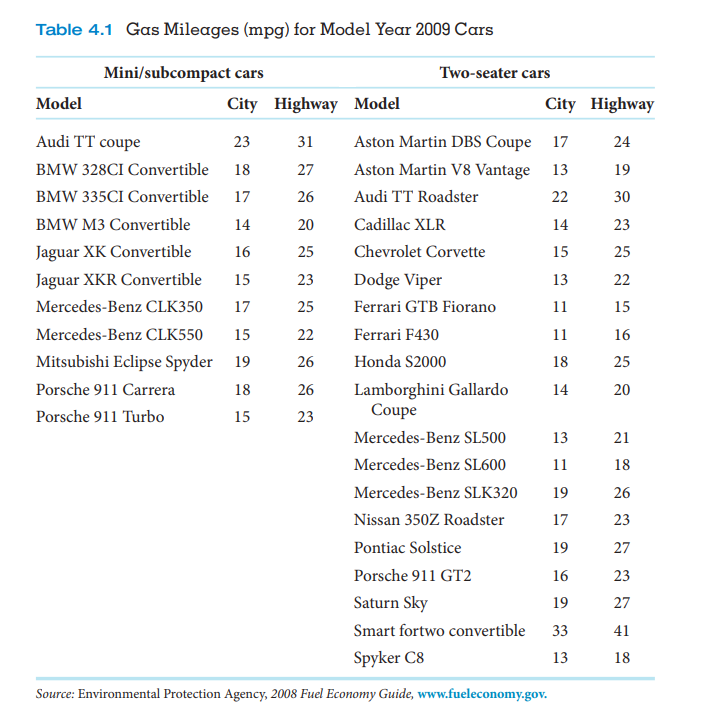
(a) Make a scatterplot that shows the relationship between city and highway mileage for minicompact cars using city mileage as the explanatory variable. Be sure to label your axes.
(b) On the same graph, make a scatterplot that shows the relationship between city and highway mileage for two-seater cars. Use a different color or plotting symbol.
(c) Describe what you see in the scatterplot. Is the form of the relationship similar for the two types of car? What is the most important difference between the two types?
Questions & Answers
QUESTION:
Fast cars Interested in a sporty car? Worried that it might use too much gas? The Environmental Protection Agency lists most such vehicles in its minicompact or two-seater categories. Table 4.1 gives city and highway gas mileages (in miles per gallon) for all model year 2009 cars in these two groups.
(a) Make a scatterplot that shows the relationship between city and highway mileage for minicompact cars using city mileage as the explanatory variable. Be sure to label your axes.
(b) On the same graph, make a scatterplot that shows the relationship between city and highway mileage for two-seater cars. Use a different color or plotting symbol.
(c) Describe what you see in the scatterplot. Is the form of the relationship similar for the two types of car? What is the most important difference between the two types?
ANSWER:Step 1 of 3
(a)
A scatterplot shows the relationship between two quantitative variables measured on the same individuals. The values of one variable appear on the horizontal axis, and the values of the other variable appear on the vertical axis. Each individual in the data appears as a point in the plot fixed by the values of both variables for that individual.
Let’s make a scatterplot to investigate the relationship between city and highway mileage for minicompact cars using city mileage as the explanatory variable. The explanatory variable is represented by the horizontal axis and the response variable on the vertical axis
The plot the individual data values on the graph as shown below using the table:
|
City |
Highway |
|
23 |
31 |
|
18 |
27 |
|
17 |
26 |
|
14 |
20 |
|
16 |
25 |
|
15 |
23 |
|
17 |
25 |
|
15 |
22 |
|
19 |
26 |
|
18 |
26 |
|
15 |
23 |
