Solution Found!
Six measurements are taken of the thickness of a piece of
Chapter 5, Problem 9E(choose chapter or problem)
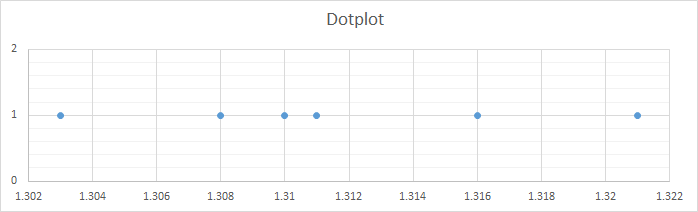
Six measurements are taken of the thickness of a piece of 18-gauge sheet metal. The measurements (in mm) are: 1.316, 1.308, 1.321, 1.303, 1.311, and 1.310.
a. Make a dotplot of the six values.
b. Should the t curve be used to find a 99% confidence interval for the thickness? If so, find the confidence interval. If not, explain why not.
c. Six independent measurements are taken of the thickness of another piece of sheet metal. The measurements this time are: 1.317, 1.318, 1.301, 1.307, 1.374, 1.323. Make a dotplot of these values.
d. Should the t curve be used to find a 95% confidence interval for the thickness of this metal? If so, find the confidence interval. If not, explain why not.
Questions & Answers
QUESTION:
Six measurements are taken of the thickness of a piece of 18-gauge sheet metal. The measurements (in mm) are: 1.316, 1.308, 1.321, 1.303, 1.311, and 1.310.
a. Make a dotplot of the six values.
b. Should the t curve be used to find a 99% confidence interval for the thickness? If so, find the confidence interval. If not, explain why not.
c. Six independent measurements are taken of the thickness of another piece of sheet metal. The measurements this time are: 1.317, 1.318, 1.301, 1.307, 1.374, 1.323. Make a dotplot of these values.
d. Should the t curve be used to find a 95% confidence interval for the thickness of this metal? If so, find the confidence interval. If not, explain why not.
ANSWER:
Problem 9E
Six measurements are taken of the thickness of a piece of 18-gauge sheet metal. The measurements (in mm) are: 1.316, 1.308, 1.321, 1.303, 1.311, and 1.310.
a. Make a dotplot of the six values.
b. Should the t curve be used to find a 99% confidence interval for the thickness? If so, find the confidence interval. If not, explain why not.
c. Six independent measurements are taken of the thickness of another piece of sheet metal. The measurements this time are: 1.317, 1.318, 1.301, 1.307, 1.374, 1.323. Make a dotplot of these values.
d. Should the t curve be used to find a 95% confidence interval for the thickness of this metal? If so, find the confidence interval. If not, explain why not.
Step by Step Solution
Step 1 of 4
(a)
A dotplot of the six values is shown below, each dot corresponds to the data values of the measurements given,