The following graphs give the profits for two small
Chapter 1, Problem 51(choose chapter or problem)
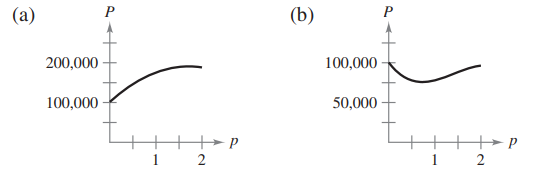
The following graphs give the profits \(P\) for two small companies over a period \(p\) of 2 years. Create a story to describe the behavior of each profit function for some hypothetical product the company produces.
Text Transcription:
P
p
Unfortunately, we don't have that question answered yet. But you can get it answered in just 5 hours by Logging in or Becoming a subscriber.
Becoming a subscriber
Or look for another answer