The article “Characteristics and Trends of River Discharge
Chapter 7, Problem 14E(choose chapter or problem)
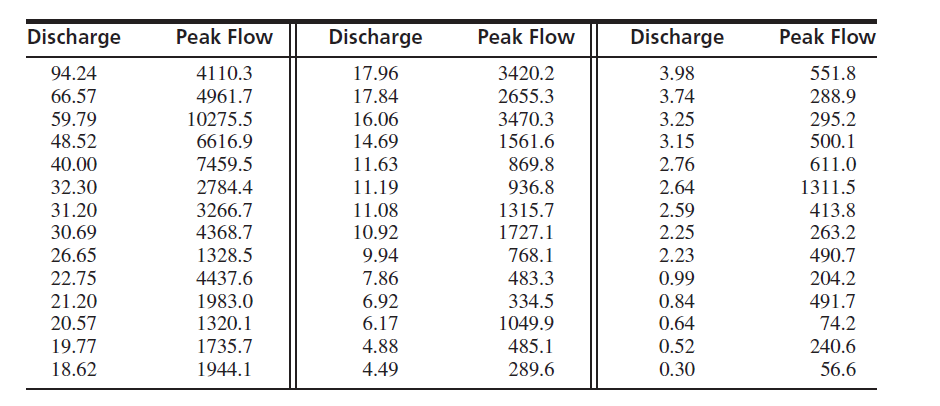
The article “Characteristics and Trends of River Discharge into Hudson, James, and Ungava Bays, 1964–2000” (S. D´ery, M. Stieglitz, et al., Journal of Climate, 2005:2540–2557) presents measurements of discharge rate x (in \(\mathrm {km^3/yr}\)) and peak flow y (in \(\mathrm {m^3/s}\)) for 42 rivers that drain into the Hudson, James, and Ungava Bays. The data are shown in the following table:
a. Compute the least-squares line for predicting y from x. Make a plot of residuals versus fitted values.
b. Compute the least-squares line for predicting y from ln x. Make a plot of residuals versus fitted values.
c. Compute the least-squares line for predicting ln y from ln x. Make a plot of residuals versus fitted values.
d. Which of the three models (a) through (c) fits best? Explain.
e. Using the best model, predict the peak flow when the discharge is 50.0 \(\mathrm {km^3/yr}\).
f. Using the best model, find a 95% prediction interval for the peak flow when the discharge is 50.0 \(\mathrm {km^3/yr}\).
Equation Transcription:
Text Transcription:
km^3/yr
m^3/s
km^3/yr
km^3/yr
Unfortunately, we don't have that question answered yet. But you can get it answered in just 5 hours by Logging in or Becoming a subscriber.
Becoming a subscriber
Or look for another answer