Solved: The article “Vehicle-Arrival Characteristics at
Chapter 8, Problem 15E(choose chapter or problem)
The article “Vehicle-Arrival Characteristics at Urban Uncontrolled Intersections” (V. Rengaraju and V. Rao, Journal of Transportation Engineering, 1995:317–323) presents data on traffic characteristics at 10 intersections in Madras, India. The following table provides data on road width in m \((x_1)\), traffic volume in vehicles per lane per hour \((x_2)\), and median speed in km/h \((x_3)\).
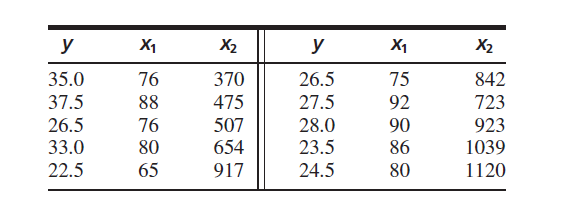
a. Fit the model \(y=\beta_{0}+\beta_{1} x_{1}+\beta_{2} x_{2}+\varepsilon\). Find the P-values for testing that the coefficients are equal to 0.
b. Fit the model \(y=\beta_{0}+\beta_{1} x_{1}+\varepsilon\). Find the P-values for testing that the coefficients are equal to 0.
c. Fit the model \(y=\beta_{0}+\beta_{1} x_{2}+\varepsilon\). Find the P-values for testing that the coefficients are equal to 0.
d. Which of the models (a) through (c) do you think is best? Why?
Equation Transcription:
Text Transcription:
(x_1)
(x_2)
(x_3)
x_1
x_2
x_1
x_2
y=beta_0+beta_1x_1+beta_2x_2+varepsilon
y=beta_0+beta_1x_1+varepsilon
y=beta_0+beta_1x_2+varepsilon
Unfortunately, we don't have that question answered yet. But you can get it answered in just 5 hours by Logging in or Becoming a subscriber.
Becoming a subscriber
Or look for another answer