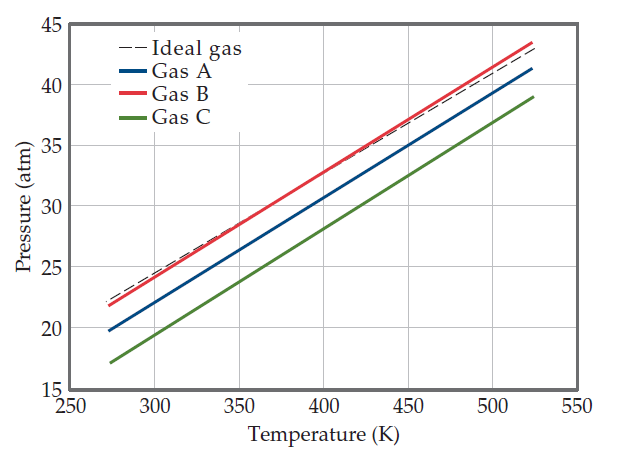
Visualizing ConceptsThe graph below shows the change in
Chapter , Problem 12E(choose chapter or problem)
The graph below shows the change in pressure as the temperature increases for a
\(1-\text { mol }\) sample of a gas confined to a \(1-L\) container. The four plots correspond to an ideal gas and three real gases: \(\mathrm{CO}_{2}, N_{2}, \text { and } \mathrm{Cl}_{2}\).
(a) At room temperature, all three real gases have a pressure less than the ideal gas. Which van der Waals constant, \(a \text { or } b \text\), accounts for the influence intermolecular forces have in lowering the pressure of a real gas?
(b) Use the van der Waals constants in Table to match the labels in the plot
\((A, B, \text { and } C)\) with the respective gases
\(\left(\mathrm{CO}_{2}, \mathrm{~N}_{2}, \text { and } \mathrm{Cl}_{2}\right)\).[Section 10.9
Equation Transcription:
Text Transcription:
1-mol
1-L
CO2, N2, and Cl2
a or b
(A,B and C)
(C02, N2, and Cl2)
Unfortunately, we don't have that question answered yet. But you can get it answered in just 5 hours by Logging in or Becoming a subscriber.
Becoming a subscriber
Or look for another answer