Solution Found!
Solved: Figure 2.68 shows the displacement graph for a
Chapter 2, Problem 66(choose chapter or problem)
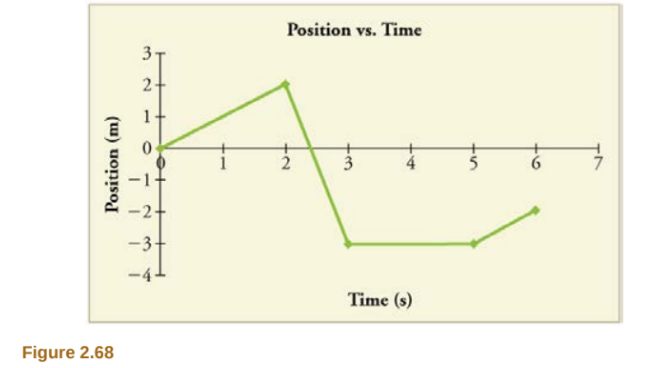
Figure 2.68 shows the displacement graph for a particle for \(5 \ s\). Draw the corresponding velocity and acceleration graphs.
Questions & Answers
QUESTION:
Figure 2.68 shows the displacement graph for a particle for \(5 \ s\). Draw the corresponding velocity and acceleration graphs.
Step 1 of 5
The rate of change of position is called velocity. It is denoted by v.
v = ds/dt
Here, ds is the change in the position, and dt is the change in the time.
The rate of change of velocity is called acceleration. It is denoted by a.
a = dv/dt
Here, dv is the change in the velocity.
Step 2 of 5
The below figure indicates the graph between the position and time as follows:

The time and corresponding position from the graph are tabulated below as,
\(\begin{array}{|c|c|} \hline \text { time }(\mathrm{s}) & \m