A flow can be visualized by plotting the velocity field as
Chapter 4, Problem 4.6(choose chapter or problem)
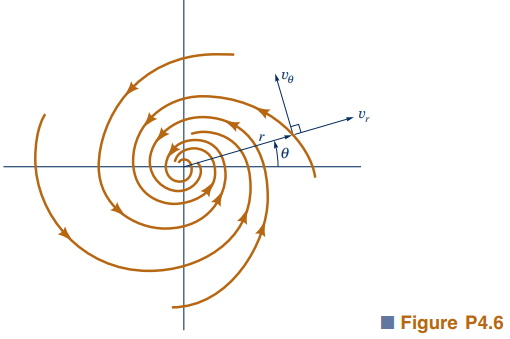
A flow can be visualized by plotting the velocity field as velocity vectors at representative locations in the flow as shown in Video V4.2 and Fig. E4.1. Consider the velocity field given in polar coordinates by \(v_r=-10/r\), and \(v_\theta=10/r\). This flow approximates a fluid swirling into a sink as shown in Fig. P4.6. Plot the velocity field at locations given by r = 1, 2, and 3 with \(\theta = 0\), 30, 60, and \(90^\circ\).
Unfortunately, we don't have that question answered yet. But you can get it answered in just 5 hours by Logging in or Becoming a subscriber.
Becoming a subscriber
Or look for another answer