Solution Found!
Solved: Frequency Polygon. In Exercises, construct the
Chapter 2, Problem 20BSC(choose chapter or problem)
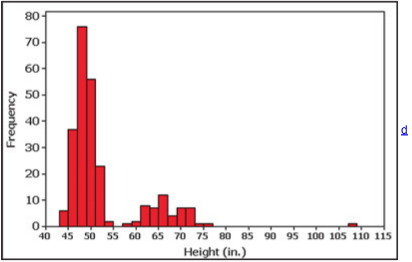
Interpreting a Histogram Refer to the histogram given for Exercises 5–8 and answer the following questions:
a. What are the possible values (rounded to the nearest inch) of the largest height included in the histogram? What are those values expressed in feet and inches?
b. Why is it wrong to say that the people with heights between 43 in. and 55 in. are the tallest people because they have the tallest bars in the histogram?
Interpreting a Histogram. In Exercises 5–8, answer the questions by referring to the following Minitab-generated histogram, which represents the heights (inches) of people randomly selected from those who entered New York City's Museum of Natural History during a recent Friday morning.
MINITAB
Questions & Answers
QUESTION:
Interpreting a Histogram Refer to the histogram given for Exercises 5–8 and answer the following questions:
a. What are the possible values (rounded to the nearest inch) of the largest height included in the histogram? What are those values expressed in feet and inches?
b. Why is it wrong to say that the people with heights between 43 in. and 55 in. are the tallest people because they have the tallest bars in the histogram?
Interpreting a Histogram. In Exercises 5–8, answer the questions by referring to the following Minitab-generated histogram, which represents the heights (inches) of people randomly selected from those who entered New York City's Museum of Natural History during a recent Friday morning.
MINITAB
ANSWER:
Solution 20BSC