Solution Found!
The diagram below describes the sample space of a
Chapter 3, Problem 2E(choose chapter or problem)
The diagram below describes the sample space of a particular experiment and events A and B.

a. What is this type of diagram called?
b. Suppose the sample points are equally likely. Find P(A) and P(B).
c. Suppose P(1) = P(2) = P(3) = P(4) = P(5) = \(\frac{1}{20}\) and P(6) = P(7) = P(8) = P(9) = P(10) = \(\frac{3}{20}\). Find P(A) and P(B).
Questions & Answers
QUESTION:
The diagram below describes the sample space of a particular experiment and events A and B.
a. What is this type of diagram called?
b. Suppose the sample points are equally likely. Find P(A) and P(B).
c. Suppose P(1) = P(2) = P(3) = P(4) = P(5) = \(\frac{1}{20}\) and P(6) = P(7) = P(8) = P(9) = P(10) = \(\frac{3}{20}\). Find P(A) and P(B).
ANSWER:Step 1 of 3
a) We have to write the given diagram name
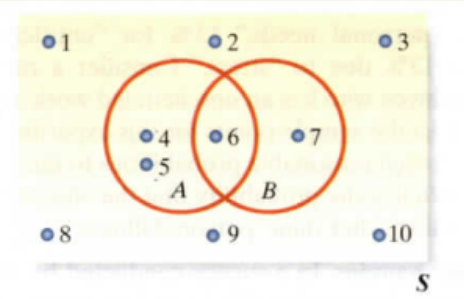
The given diagram is called as venn diagram