Solution Found!
Answer: Lobster trap placement. Refer to the Bulletin of
Chapter 7, Problem 52E(choose chapter or problem)
Lobster trap placement. Refer to the Bulletin of Marine Science (April 2010) observational study of lobster trap placement by teams fishing for the red spiny lobster in Baja California Sur, Mexico. Trap spacing measurements (in meters) for a sample of seven teams of red spiny lobster fishermen are reproduced in the accompanying table (and saved in the TRAPSPACE file). Let μ represent the average of the trap spacing measurements for the population of red spiny lobster fishermen fishing in Baja California Sur, Mexico. In Exercise 5.35 you computed the mean and standard deviation of the sample measurements to be = 89.9 meters and s = 11.6 meters, respectively. Suppose you want to determine if the true value of μ differs from 95 meters.


From Shester, G. G. “Explaining catch variation among Baja California lobster fishers through spatial analysis of trap-placement decisions.” Bulletin of Marine Science, Vol. 86, No. 2, April 2010 ( Table 1 ), pp. 479–498. Reprinted with permission from the University of Miami – Bulletin of Marine Science.
a. Specify the null and alternative hypothesis for this test.
b. Since = 89.9 is less than 95, a fisherman wants to reject the null hypothesis. What are the problems with using such a decision rule?
c. Compute the value of the test statistic.
d. Find the approximate p -value of the test.
e. Select a value of a , the probability of a Type I error. Interpret this value in the words of the problem.
f. Give the appropriate conclusion, based on the results of parts d and e.
g. What conditions must be satisfied for the test results to be valid?
h. In Exercise 5.35 you found a 95% confidence interval for μ . Does the interval support your conclusion in part f ?
Lobster trap placement. Strategic placement of lobster traps is one of the keys for a successful lobster fisherman. An observational study of teams fishing for the red spiny lobster in Baja California Sur, Mexico, was conducted and the results published in Bulletin of Marine Science (April, 2010). One of the variables of interest was the average distance separating traps—called trap spacing—deployed by the same team of fishermen. Trap spacing measurements (in meters) for a sample of seven teams of red spiny lobster fishermen are shown in the accompanying table (and saved in the TRAPSPACE file). Of interest is the mean trap spacing for the population of red spiny lobster fishermen fishing in Baja California Sur, Mexico.
From Shester, G. G. “Explaining catch variation among Baja California lobster fishers through spatial analysis of trap-placement decisions.” Bulletin of Marine Science, Vol. 86, No. 2, April 2010 ( Table 1 ), pp. 479–498. Reprinted with permission from the University of Miami – Bulletin of Marine Science.
a. Identify the target parameter for this study.
b. Compute a point estimate of the target parameter.
c. What is the problem with using the normal ( z ) statistic to find a confidence interval for the target parameter?
d. Find a 95% confidence interval for the target parameter.
e. Give a practical interpretation of the interval, part d .
f. What conditions must be satisfied for the interval, part d , to be valid?
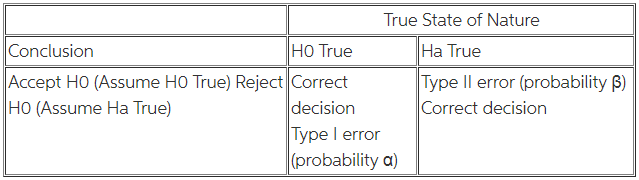
Conclusions and Consequences for a Test of Hypothesis
Questions & Answers
QUESTION:
Lobster trap placement. Refer to the Bulletin of Marine Science (April 2010) observational study of lobster trap placement by teams fishing for the red spiny lobster in Baja California Sur, Mexico. Trap spacing measurements (in meters) for a sample of seven teams of red spiny lobster fishermen are reproduced in the accompanying table (and saved in the TRAPSPACE file). Let μ represent the average of the trap spacing measurements for the population of red spiny lobster fishermen fishing in Baja California Sur, Mexico. In Exercise 5.35 you computed the mean and standard deviation of the sample measurements to be = 89.9 meters and s = 11.6 meters, respectively. Suppose you want to determine if the true value of μ differs from 95 meters.
From Shester, G. G. “Explaining catch variation among Baja California lobster fishers through spatial analysis of trap-placement decisions.” Bulletin of Marine Science, Vol. 86, No. 2, April 2010 ( Table 1 ), pp. 479–498. Reprinted with permission from the University of Miami – Bulletin of Marine Science.
a. Specify the null and alternative hypothesis for this test.
b. Since = 89.9 is less than 95, a fisherman wants to reject the null hypothesis. What are the problems with using such a decision rule?
c. Compute the value of the test statistic.
d. Find the approximate p -value of the test.
e. Select a value of a , the probability of a Type I error. Interpret this value in the words of the problem.
f. Give the appropriate conclusion, based on the results of parts d and e.
g. What conditions must be satisfied for the test results to be valid?
h. In Exercise 5.35 you found a 95% confidence interval for μ . Does the interval support your conclusion in part f ?
Lobster trap placement. Strategic placement of lobster traps is one of the keys for a successful lobster fisherman. An observational study of teams fishing for the red spiny lobster in Baja California Sur, Mexico, was conducted and the results published in Bulletin of Marine Science (April, 2010). One of the variables of interest was the average distance separating traps—called trap spacing—deployed by the same team of fishermen. Trap spacing measurements (in meters) for a sample of seven teams of red spiny lobster fishermen are shown in the accompanying table (and saved in the TRAPSPACE file). Of interest is the mean trap spacing for the population of red spiny lobster fishermen fishing in Baja California Sur, Mexico.
From Shester, G. G. “Explaining catch variation among Baja California lobster fishers through spatial analysis of trap-placement decisions.” Bulletin of Marine Science, Vol. 86, No. 2, April 2010 ( Table 1 ), pp. 479–498. Reprinted with permission from the University of Miami – Bulletin of Marine Science.
a. Identify the target parameter for this study.
b. Compute a point estimate of the target parameter.
c. What is the problem with using the normal ( z ) statistic to find a confidence interval for the target parameter?
d. Find a 95% confidence interval for the target parameter.
e. Give a practical interpretation of the interval, part d .
f. What conditions must be satisfied for the interval, part d , to be valid?
Conclusions and Consequences for a Test of Hypothesis
ANSWER: