Solution Found!
Solved: Structurally deficient highway bridges. Refer to
Chapter 11, Problem 34E(choose chapter or problem)
Structurally deficient highway bridges. Refer to Exercise 1.28 (p. 27) and the data on structurally deficient highway bridges compiled by the Federal Highway Administration (FHWA) into the National Bridge Inventory (NBI). For each state, the NBI lists the number of structurally deficient bridges and the total area (thousands of square feet) of the deficient bridges. The data for the 50 states (plus the District of Columbia and Puerto Rico) are saved in the file. (The first five and last five observations are listed in the table in the next column.) For
State |
Number |
Area (thousands of sq. ft.) |
Alabama |
1,899 |
432.7 |
Alaska |
155 |
60.9 |
Arizona |
181 |
110.5 |
Arkansas |
997 |
347.3 |
California |
3,140 |
5,177.90 |
. |
. |
. |
Washington |
400 |
502 |
West Virginia |
1,058 |
331.5 |
Wisconsin |
1,302 |
399.8 |
Wyoming |
389 |
143.4 |
Puerto Rico |
241 |
195.4 |
future planning and budgeting, the FHWA wants to estimate the total area of structurally deficient bridges in a state based on the number of deficient bridges.
a. Write the equation of a straight-line model relating total area (y) to number of structurally deficient bridges (x).
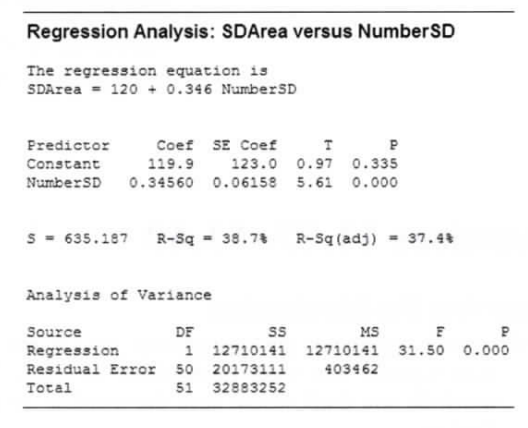
b. The model, part a, was fit to the data using Minitab, as shown below. Find the least squares prediction equation on the printout.
c. List the assumptions required for the regression analysis.
d. Locate the estimated standard error of the regression model, s, on the printout.
e. Use the value of s to find a range where most (about 95%) of the errors of prediction will fall.
Questions & Answers
QUESTION:
Structurally deficient highway bridges. Refer to Exercise 1.28 (p. 27) and the data on structurally deficient highway bridges compiled by the Federal Highway Administration (FHWA) into the National Bridge Inventory (NBI). For each state, the NBI lists the number of structurally deficient bridges and the total area (thousands of square feet) of the deficient bridges. The data for the 50 states (plus the District of Columbia and Puerto Rico) are saved in the file. (The first five and last five observations are listed in the table in the next column.) For
State |
Number |
Area (thousands of sq. ft.) |
Alabama |
1,899 |
432.7 |
Alaska |
155 |
60.9 |
Arizona |
181 |
110.5 |
Arkansas |
997 |
347.3 |
California |
3,140 |
5,177.90 |
. |
. |
. |
Washington |
400 |
502 |
West Virginia |
1,058 |
331.5 |
Wisconsin |
1,302 |
399.8 |
Wyoming |
389 |
143.4 |
Puerto Rico |
241 |
195.4 |
future planning and budgeting, the FHWA wants to estimate the total area of structurally deficient bridges in a state based on the number of deficient bridges.
a. Write the equation of a straight-line model relating total area (y) to number of structurally deficient bridges (x).
b. The model, part a, was fit to the data using Minitab, as shown below. Find the least squares prediction equation on the printout.
c. List the assumptions required for the regression analysis.
d. Locate the estimated standard error of the regression model, s, on the printout.
e. Use the value of s to find a range where most (about 95%) of the errors of prediction will fall.
ANSWER:
Step 1 of 5
a)
The equation of a straight line model relating total area (y) to number of structurally deficient bridges (x) is given below:

Where, y = response variable (Total area)
x = explanatory variable (Number of structurally deficient bridges)


