Solution Found!
Decimal Data: Batting Averages The following data
Chapter , Problem 14(choose chapter or problem)
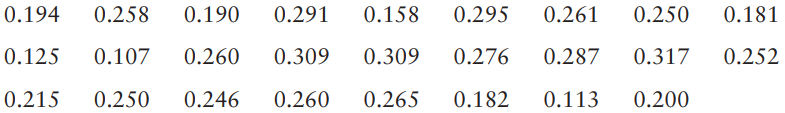
Decimal Data: Batting Averages The following data represent baseball batting averages for a random sample of National League players near the end of the baseball season. The data are from the baseball statistics section of The Denver Post.
0.194, 0.258, 0.19, 0.291, 0.158, 0.295, 0.261, 0.25, 0.181, 0.125, 0.107, 0.26, 0.309, 0.309,
0.276, 0.287, 0.317, 0.252, 0.215, 0.25, 0.246, 0.26, 0.265, 0.182, 0.113, 0.2
(a) Multiply each data value by 1000 to “clear” the decimals.
(b) Use the standard procedures of this section to make a frequency table and histogram with your whole-number data. Use five classes.
(c) Divide class limits, class boundaries, and class midpoints by 1000 to get back to your original data.
Questions & Answers
QUESTION:
Decimal Data: Batting Averages The following data represent baseball batting averages for a random sample of National League players near the end of the baseball season. The data are from the baseball statistics section of The Denver Post.
0.194, 0.258, 0.19, 0.291, 0.158, 0.295, 0.261, 0.25, 0.181, 0.125, 0.107, 0.26, 0.309, 0.309,
0.276, 0.287, 0.317, 0.252, 0.215, 0.25, 0.246, 0.26, 0.265, 0.182, 0.113, 0.2
(a) Multiply each data value by 1000 to “clear” the decimals.
(b) Use the standard procedures of this section to make a frequency table and histogram with your whole-number data. Use five classes.
(c) Divide class limits, class boundaries, and class midpoints by 1000 to get back to your original data.
ANSWER:Step 1 of 4
Given:
The number of National League Players is
The data representing average of batting of players in baseball is given below: