Solution Found!
Solved: Hurricanes In 2005, hurricane Katrina struck the
Chapter , Problem 5.1.99(choose chapter or problem)
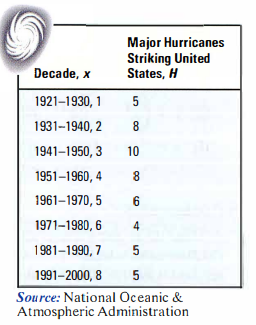
Hurricanes In 2005, hurricane Katrina struck the Gulf Coast of the United States, killing 1289 people and causing an estimated $200 billion in damage. The following data represent the number of major hurricane strikes in the US. (category 3, 4, or 5) each decade from 1921 to 2000.
(a) Draw a scatter diagram of the data. Comment on the type of relation that may exist between the two variables.
(b) The cubic function of best fit to these data is
\(H(x)=0.16 x^{3}-2.32 x^{2}+9.33 x-2.21\)
(c) Use a graphing utility to verify that the function given in part (b) is the cubic function of best fit.
(d) With a graphing utility, draw a scatter diagram of the data and then graph the cubic function of best fit on the scatter diagram.
(e) Concern has risen about the increase in the number and intensity of hurricanes, but some scientists believe this is just a natural fluctuation that could last another decade or two. Use your model to predict the number of major hurricanes that Source: National Oceanic & Atmospheric Administration will strike the United States between 2001 and 2010. Does your result appear to agree with what these scientists believe?
(f) From 2001-2005, five major hurricanes had struck the United States. Does this support or contradict your prediction in part (e)?
Questions & Answers
QUESTION:
Hurricanes In 2005, hurricane Katrina struck the Gulf Coast of the United States, killing 1289 people and causing an estimated $200 billion in damage. The following data represent the number of major hurricane strikes in the US. (category 3, 4, or 5) each decade from 1921 to 2000.
(a) Draw a scatter diagram of the data. Comment on the type of relation that may exist between the two variables.
(b) The cubic function of best fit to these data is
\(H(x)=0.16 x^{3}-2.32 x^{2}+9.33 x-2.21\)
(c) Use a graphing utility to verify that the function given in part (b) is the cubic function of best fit.
(d) With a graphing utility, draw a scatter diagram of the data and then graph the cubic function of best fit on the scatter diagram.
(e) Concern has risen about the increase in the number and intensity of hurricanes, but some scientists believe this is just a natural fluctuation that could last another decade or two. Use your model to predict the number of major hurricanes that Source: National Oceanic & Atmospheric Administration will strike the United States between 2001 and 2010. Does your result appear to agree with what these scientists believe?
(f) From 2001-2005, five major hurricanes had struck the United States. Does this support or contradict your prediction in part (e)?
Step 1 of 6
(a)
Consider the scatter diagram for the given points is shown in Figure below.
