Solution Found!
Hampson and Walker also made measurements of the heats of
Chapter , Problem 26(choose chapter or problem)
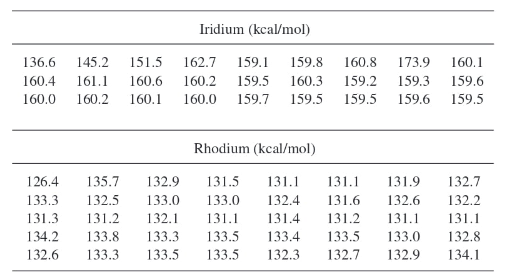
Hampson and Walker also made measurements of the heats of sublimation of rhodium and iridium. Do the following calculations for each of the two given sets of data:
a. Make a histogram.
b. Make a stem-and-leaf plot.
c. Make a boxplot.
d. Plot the observations in the order of the experiment.
e. Does that statistical model of independent and identically distributed measurement errors seem reasonable?
f. Find the mean, 10% and 20% trimmed means, and median and compare them.
g. Find the standard error of the sample mean and a corresponding approximate 90% confidence interval.
h. Find a confidence interval based on the median that has as close to 90% coverage as possible.
i. Use the bootstrap to approximate the sampling distributions of the 10% and 20% trimmed means and their standard errors and compare.
j. Use the bootstrap to approximate the sampling distribution of the median and its standard error. Compare to the corresponding results for trimmed means above.
k. Find approximate 90% confidence intervals based on the trimmed means and compare to the intervals for the mean and median found previously.
Questions & Answers
QUESTION:
Hampson and Walker also made measurements of the heats of sublimation of rhodium and iridium. Do the following calculations for each of the two given sets of data:
a. Make a histogram.
b. Make a stem-and-leaf plot.
c. Make a boxplot.
d. Plot the observations in the order of the experiment.
e. Does that statistical model of independent and identically distributed measurement errors seem reasonable?
f. Find the mean, 10% and 20% trimmed means, and median and compare them.
g. Find the standard error of the sample mean and a corresponding approximate 90% confidence interval.
h. Find a confidence interval based on the median that has as close to 90% coverage as possible.
i. Use the bootstrap to approximate the sampling distributions of the 10% and 20% trimmed means and their standard errors and compare.
j. Use the bootstrap to approximate the sampling distribution of the median and its standard error. Compare to the corresponding results for trimmed means above.
k. Find approximate 90% confidence intervals based on the trimmed means and compare to the intervals for the mean and median found previously.
ANSWER:
Step 1 of 11
a.
Histogram of rhodium and iridium constructed as follows.

The above graph indicates that iridium is approximately normally distributed.
The above graph indicates that Rhodium data has outliers. The data is not normally distributed.