An experiment was done to test a method for reducing
Chapter , Problem 39(choose chapter or problem)
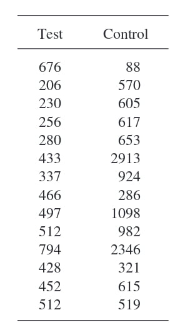
An experiment was done to test a method for reducing faults on telephone lines (Welch 1987). Fourteen matched pairs of areas were used. The following table shows the fault rates for the control areas and for the test areas:
a. Plot the differences versus the control rate and summarize what you see.
b. Calculate the mean difference, its standard deviation, and a confidence interval.
c. Calculate the median difference and a confidence interval and compare to the previous result.
d. Do you think it is more appropriate to use a t test or a nonparametric method to test whether the apparent difference between test and control could be due to chance? Why? Carry out both tests and compare.
Unfortunately, we don't have that question answered yet. But you can get it answered in just 5 hours by Logging in or Becoming a subscriber.
Becoming a subscriber
Or look for another answer