The following table shows the monthly returns of stock in
Chapter , Problem 51(choose chapter or problem)
The following table shows the monthly returns of stock in Disney, MacDonalds, Schlumberger, and Haliburton for January through May 1998. Fit a multiple regression to predict Disney returns from those of the other stocks. What is the standard deviation of the residuals? What is \(R^2\) ?
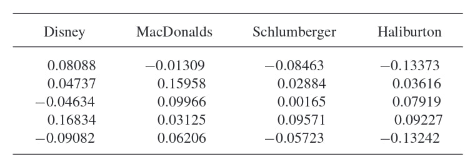
Next, using the regression equation you have just found, carry out the predictions for January through May of 1999 and compare to the actual data listed below. What is the standard deviation of the prediction error? How can the comparison with the results from 1998 be explained? Is a reasonable explanation that the fundamental nature of the relationships changed in the one year period?

Unfortunately, we don't have that question answered yet. But you can get it answered in just 5 hours by Logging in or Becoming a subscriber.
Becoming a subscriber
Or look for another answer