Solution Found!
Predict/Explain (a) Referring to the hanging planter in
Chapter 6, Problem 38P(choose chapter or problem)
CE Predict/Explain (a) Referring to the hanging planter in Example , which of the three graphs
, or
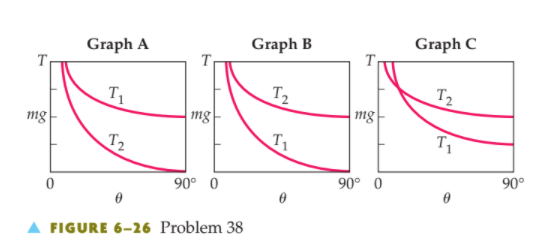
in Figure 6-26 shows an accurate plot of the tensions \(T_1\) and \(T_2\) as a function of the angle \(\theta\)? (b) Choose the best explanation from among the following:
I. The two tensions must be equal at some angle between \(\theta=0\) and \(\theta=90^\circ\).
II. \(T_2\) is greater than \(T_1\) at all angles, and is equal to at \(\(\theta=90^\circ\)\).
III. \(T_2\) is less than \(T_1\) at all angles, and is equal to 0 at \(\(\theta=90^\circ\)\).
Equation Transcription:
Text Transcription:
T_1
T_2
theta
theta=0
theta=90^o
T_2
T_1
theta=90^o
T_2
T_1
theta=90^o
T_1
T_2
90^o
T_2
T_1
90^o
T_2
T_1
90^o
Questions & Answers
QUESTION:
CE Predict/Explain (a) Referring to the hanging planter in Example , which of the three graphs
, or
in Figure 6-26 shows an accurate plot of the tensions \(T_1\) and \(T_2\) as a function of the angle \(\theta\)? (b) Choose the best explanation from among the following:
I. The two tensions must be equal at some angle between \(\theta=0\) and \(\theta=90^\circ\).
II. \(T_2\) is greater than \(T_1\) at all angles, and is equal to at \(\(\theta=90^\circ\)\).
III. \(T_2\) is less than \(T_1\) at all angles, and is equal to 0 at \(\(\theta=90^\circ\)\).
Equation Transcription:
Text Transcription:
T_1
T_2
theta
theta=0
theta=90^o
T_2
T_1
theta=90^o
T_2
T_1
theta=90^o
T_1
T_2
90^o
T_2
T_1
90^o
T_2
T_1
90^o
ANSWER:
a.)
Step 1 of 2
We have to choose among the three graphs which one shows an accurate plot of the tensions and
as a function of the angle
.
The relation connecting the two tensions and
with the angle
is given by,
(Example 6-5)
Now, is always greater than
since the vertical component should support the weight
of the pot of flowers and horizontal component should be balanced by
Since, (Example 6-5)
Increasing by 90o would decrease
from large value to
. This means that there is no horizontal force from
which is required to balance the horizontal component of
making
to become zero.
Hence, the correct graph which depicts the above criteria is Graph B.
Therefore, the graph B shows an shows an accurate plot of the tensions and
as a function of the angle
.
b.)