Solution Found!
The circle graph shows a breakdown of spending for the
Chapter 8, Problem 51(choose chapter or problem)
The circle graph shows a breakdown of spending for the average U.S. household using 365 days worked as a basis of comparison. Use this information to solve Exercises 51 – 52. Round answers to the nearest tenth of a percent.
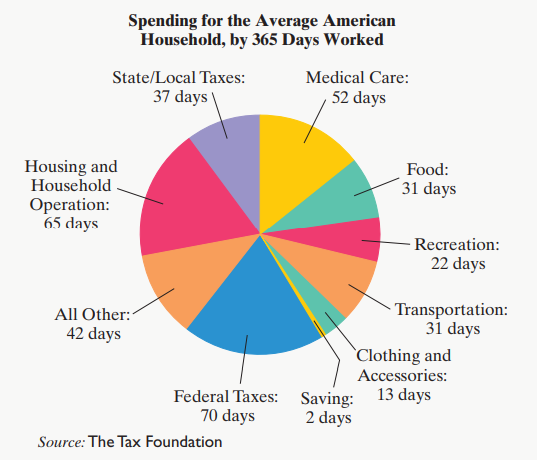
What percentage of work time does the average U.S. household spend paying for federal taxes?
Questions & Answers
QUESTION:
The circle graph shows a breakdown of spending for the average U.S. household using 365 days worked as a basis of comparison. Use this information to solve Exercises 51 – 52. Round answers to the nearest tenth of a percent.
What percentage of work time does the average U.S. household spend paying for federal taxes?
ANSWER:Problem 51
The circle graph shows a breakdown of spending for the average U.S. household using 365 days worked as a basis of comparison. Round answers to the nearest tenth of a percent.
Spending for the Average American Household, by 365 Days Worked
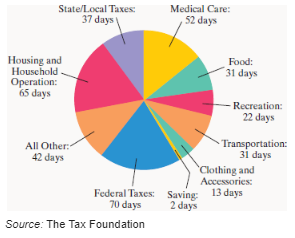
What percentage of work time does the average U.S. household spend paying for federal taxes?
Step by Step Solution
Step 1 of 2
Consider the graph from the textbook.
The objective is to find the percentage of work that was spent by the average U.S. household for federal taxes.