Health Care Expenditures The table shows annual personal health care expenditures (in
Chapter 3, Problem 74(choose chapter or problem)
The table shows annual personal health care expenditures (in billions of dollars) in the United States from 2011 through 2013. (Source: Bureau of Economic Analysis)
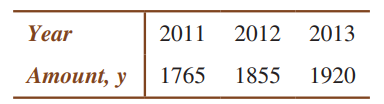
(a) Create a system of linear equations for the data to fit the curve
\(y=a t^{2}+b t+c\)
where t = 1 corresponds to 2011, and y is the amount of the expenditure.
(b) Use Cramer’s Rule to solve the system.
(c) Use a graphing utility to plot the data and graph the polynomial function in the same viewing window.
(d) Briefly describe how well the polynomial function fits the data.
Text Transcription:
y=a t^{2}+b t+c
Unfortunately, we don't have that question answered yet. But you can get it answered in just 5 hours by Logging in or Becoming a subscriber.
Becoming a subscriber
Or look for another answer