The table shows the monthly normal precipitation P (in inches) for San Francisco
Chapter 3, Problem 17(choose chapter or problem)
Why you should learn it (p. 307) The table shows the monthly normal precipitation P (in inches) for San Francisco, California. (Source: The Weather Channel)
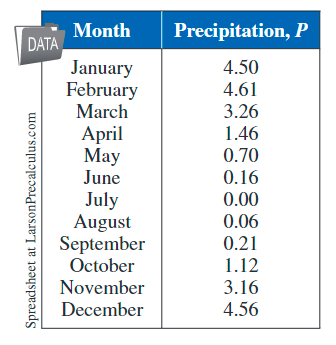
(a) Use a graphing utility to create a scatter plot of the data. Let t represent the month, with t = 1 corresponding to January.
(b) Use the regression feature of the graphing utility to find a quadratic model for the data and identify the coefficient of determination.
(c) Use the graphing utility to graph the model with the scatter plot from part (a).
(d) Use the graph from part (c) to determine in which month the normal precipitation in San Francisco is the least.
(e) Use the table to determine the month in which the normal precipitation in San Francisco is the least. Compare your answer with that of part (d).
Unfortunately, we don't have that question answered yet. But you can get it answered in just 5 hours by Logging in or Becoming a subscriber.
Becoming a subscriber
Or look for another answer