The table shows the yearly sales S (in millions of dollars) of Whole Foods Market for
Chapter 4, Problem 31(choose chapter or problem)
The table shows the yearly sales S (in millions of dollars) of Whole Foods Market for the years 2006 through 2013. (Source: Whole Foods Market)
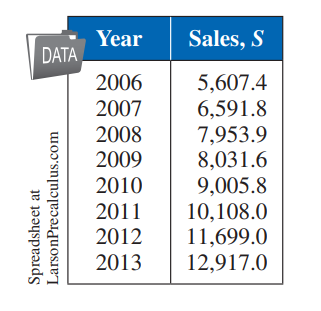
(a) Use the regression feature of a graphing utility to find an exponential model and a power model for the data and identify the coefficient of determination for each model. Let t represent the year, with t = 6 corresponding to 2006.
(b) Use the graphing utility to graph each model with the data.
(c) Use the coefficients of determination to determine which model fits the data better.
Unfortunately, we don't have that question answered yet. But you can get it answered in just 5 hours by Logging in or Becoming a subscriber.
Becoming a subscriber
Or look for another answer