The table shows the numbers of single beds B (in thousands) on North American cruise
Chapter 4, Problem 32(choose chapter or problem)
The table shows the numbers of single beds B (in thousands) on North American cruise ships from 2007 through 2012. (Source: Cruise Lines International Association)
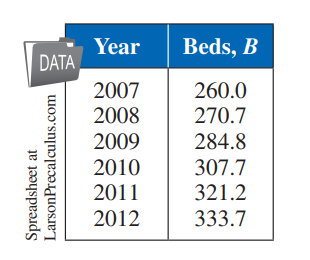
(a) Use the regression feature of a graphing utility to find a linear model, an exponential model, and a logarithmic model for the data and identify the coefficient of determination for each model. Let t represent the year, with t = 7 corresponding to 2007.
(b) Which model is the best fit for the data? Explain.
(c) Use the model you chose in part (b) to predict the number of beds in 2017. Is the number reasonable?
Unfortunately, we don't have that question answered yet. But you can get it answered in just 5 hours by Logging in or Becoming a subscriber.
Becoming a subscriber
Or look for another answer