Alcohol-Related Traffic Fatalities The frequency histogram in the next column represents
Chapter 2, Problem 11(choose chapter or problem)
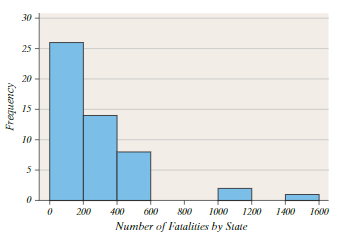
The frequency histogram in the next column represents the number of alcohol-related traffic fatalities by state (including Washington, D.C.) in 2008 according to the National Highway Traffic Safety Administration.
(a) Determine the class width.
(b) Identify the classes.
(c) Which class has the highest frequency?
(d) Describe the shape of the distribution.
(e) A reporter writes the following statement: According to the data, Texas had 1463 alcohol-related deaths, while Vermont had only 15. So the roads in Vermont are much safer. Explain what is wrong with this statement and how a fair comparison can be made between alcohol-related traffic fatalities in Texas versus Vermont.
Unfortunately, we don't have that question answered yet. But you can get it answered in just 5 hours by Logging in or Becoming a subscriber.
Becoming a subscriber
Or look for another answer