Solution Found!
Answer: Calculating Using Grouped Data In Exercise, make a
Chapter 2, Problem 41E(choose chapter or problem)
Calculating Using Grouped Data In Exercises 39–42, make a frequency distribution for the data. Then use the table to estimate the sample mean and the sample standard deviation of the data set.
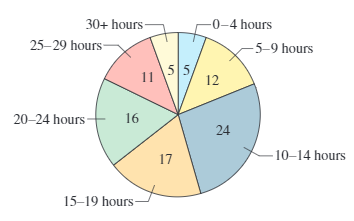
Weekly Study Hours The distribution of the numbers of hours that a random sample of college students study per week is shown in the pie chart. Use 32 as the midpoint for \(\text { "30+ hours." }\)
Equation Transcription:
Text Transcription:
''30+ hours''
Questions & Answers
QUESTION:
Calculating Using Grouped Data In Exercises 39–42, make a frequency distribution for the data. Then use the table to estimate the sample mean and the sample standard deviation of the data set.
Weekly Study Hours The distribution of the numbers of hours that a random sample of college students study per week is shown in the pie chart. Use 32 as the midpoint for \(\text { "30+ hours." }\)
Equation Transcription:
Text Transcription:
''30+ hours''
ANSWER:Solution:
Step 1 of 2:
We have the pie chart of weekly study hours

The claim is to make the frequency distribution and find the sample mean and the sample standard deviation.