Solution Found!
Fuel economy The boxplot shows the fuel economy ratings
Chapter 1, Problem 8E(choose chapter or problem)
Fuel economy The boxplot shows the fuel economy ratings for 67 model year 2012 subcompact cars. Some summary statistics are also provided. The extreme outlier is the Mitsubishi i-MiEV, an electric car whose electricity usage is equivalent to 112 miles per gallon.
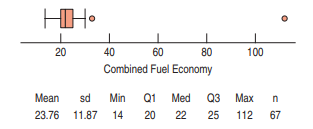
If that electric car is removed from the data set, how will the standard deviation be affected? The IQR?
Questions & Answers
QUESTION:
Fuel economy The boxplot shows the fuel economy ratings for 67 model year 2012 subcompact cars. Some summary statistics are also provided. The extreme outlier is the Mitsubishi i-MiEV, an electric car whose electricity usage is equivalent to 112 miles per gallon.
If that electric car is removed from the data set, how will the standard deviation be affected? The IQR?
ANSWER:Step 1 of 2
Since we know that the IQR(Interquartile range) is difference between third and first quartile, i.e Q3 and Q1.
Therefore the extreme value of 112 miles/gallon which falls in the 4th quartile will not affect the IQR value. Thus, even if we remove the electric car, the IQR value will remain same.