Solution Found!
Solved: Pizza prices again Look again at the histogram of
Chapter 1, Problem 31E(choose chapter or problem)
Problem 31E
Pizza prices again Look again at the histogram of the pizza prices in Exercise 29.
a) Is the mean closer to $2.40, $2.60, or $2.80? Why?
b) Is the standard deviation closer to $0.15, $0.50, or $1.00? Explain.
Exercise 29:
Pizza prices The histogram shows the distribution of the prices of plain pizza slices (in $) for 156 weeks in Dallas, TX.

Which summary statistics would you choose to summarize the center and spread in these data? Why?
Questions & Answers
QUESTION:
Problem 31E
Pizza prices again Look again at the histogram of the pizza prices in Exercise 29.
a) Is the mean closer to $2.40, $2.60, or $2.80? Why?
b) Is the standard deviation closer to $0.15, $0.50, or $1.00? Explain.
Exercise 29:
Pizza prices The histogram shows the distribution of the prices of plain pizza slices (in $) for 156 weeks in Dallas, TX.
Which summary statistics would you choose to summarize the center and spread in these data? Why?
ANSWER:
Problem 31E
Pizza prices again Look at the histogram of the pizza prices in Exercise 29.
a) Is the mean closer to $2.40, $2.60, or $2.80? Why?
b) Is the standard deviation closer to $0.15, $0.50, or $1.00? Explain.

Step by Step Solution
Step 1 of 3
Given: The histogram representing the distribution of the prices of pizza slices (in $) for 156 weeks in Dallas, TX is given as,
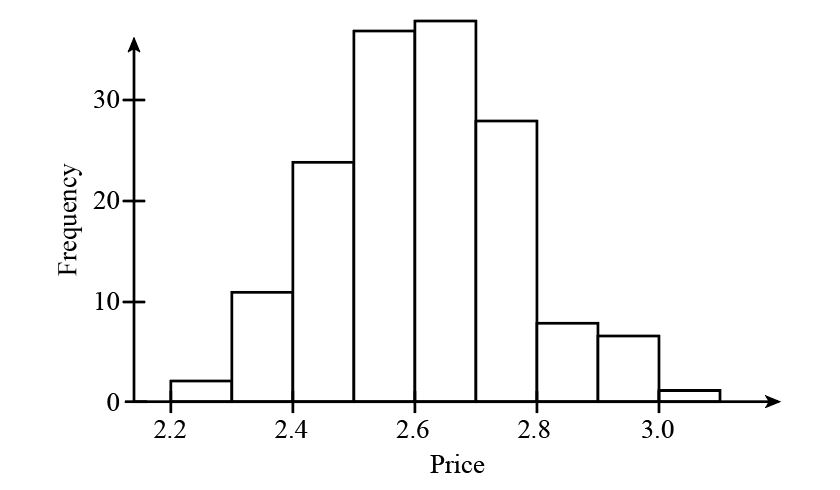
Fig (1)