Solution Found!
Wisconsin ACT math The histogram shows the distribution of
Chapter 5, Problem 12E(choose chapter or problem)
Problem 12E
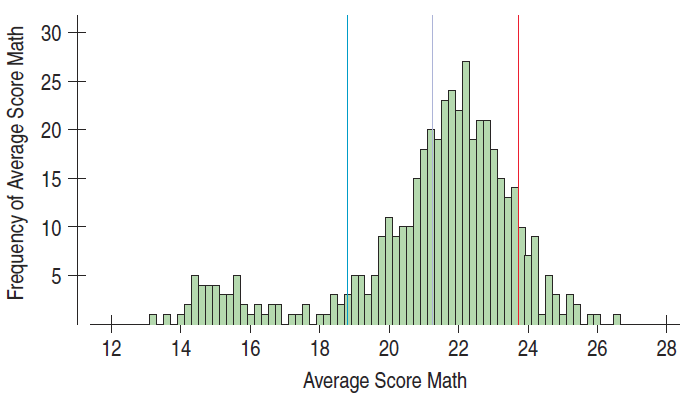
Wisconsin ACT math The histogram shows the distribution of mean ACT mathematics scores for all Wisconsin public schools in 2011. The vertical lines show the mean and one standard deviation above and below the mean. 78.8% of the data points are between the two outer lines.
a) Give two reasons that a Normal model is not appropriate for these data.

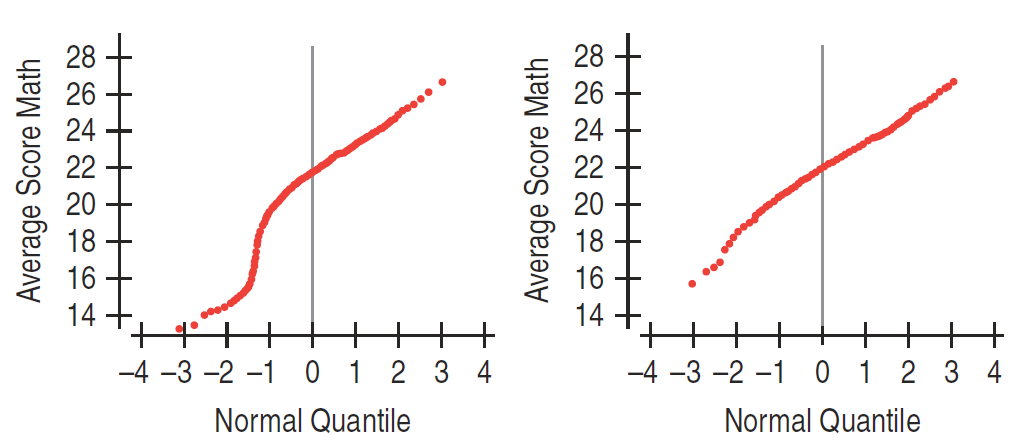
b) The Normal probability plot on the left shows the distribution of these scores. The plot on the right shows the same data with the Milwaukee area schools (mostly in the low mode) removed. What do these plots tell you about the shape of the distributions?

Questions & Answers
QUESTION:
Problem 12E
Wisconsin ACT math The histogram shows the distribution of mean ACT mathematics scores for all Wisconsin public schools in 2011. The vertical lines show the mean and one standard deviation above and below the mean. 78.8% of the data points are between the two outer lines.
a) Give two reasons that a Normal model is not appropriate for these data.
b) The Normal probability plot on the left shows the distribution of these scores. The plot on the right shows the same data with the Milwaukee area schools (mostly in the low mode) removed. What do these plots tell you about the shape of the distributions?
ANSWER:
Problem 12E
Wisconsin ACT math The histogram shows the distribution of mean ACT mathematics scores for all Wisconsin public schools in 2011. The vertical lines show the mean and one standard deviation above and below the mean. 78.8% of the data points are between the two outer lines.
a) Give two reasons that a Normal model is not appropriate for these data.
b) The Normal probability plot on the left shows the distribution of these scores. The plot on the right shows the same data with the Milwaukee area schools (mostly in the low mode) removed. What do these plots tell you about the shape of the distributions?
Step by Step Solution
Step 1 of 2
(a)
According to the 68-98-99.7 rule. In a Normal model, about 68% of the values fall within 1 standard deviation of the mean. But here it’s given that 78.8% fall within 1 standard deviation of the mean. Therefore, the Normal model is not appropriate for these data.
The distribution is left skewed because the highest bar is on the right side of the histogram. Normal models are appropriate for distributions whose shapes are unimodal and roughly symmetric. So Normal model is not appropriate for these data