Solution Found!
Acid rain Based on long-term investigation, researchers
Chapter 5, Problem 21E(choose chapter or problem)
Acid rain Based on long-term investigation, researchers have suggested that the acidity (pH) of rainfall in the Shenandoah Mountains can be described by the Normal model N(4.9, 0.6).
a) Draw and carefully label the model.
b) What percent of storms produce rainfall with pH over 6?
c) What percent of storms produce rainfall with pH under 4?
d) The lower the pH, the more acidic the rain. What is the pH level for the most acidic 20% of all storms?
e) What is the pH level for the least acidic 5% of all storms?
f) What is the IQR for the pH of rainfall?
Questions & Answers
QUESTION:
Acid rain Based on long-term investigation, researchers have suggested that the acidity (pH) of rainfall in the Shenandoah Mountains can be described by the Normal model N(4.9, 0.6).
a) Draw and carefully label the model.
b) What percent of storms produce rainfall with pH over 6?
c) What percent of storms produce rainfall with pH under 4?
d) The lower the pH, the more acidic the rain. What is the pH level for the most acidic 20% of all storms?
e) What is the pH level for the least acidic 5% of all storms?
f) What is the IQR for the pH of rainfall?
ANSWER:Step 1 of 6
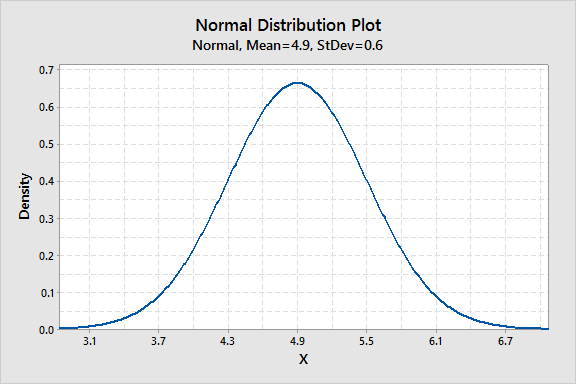
(a)
We are asked to draw and carefully label the model.
We have given the acidity (pH) of rainfall follows the normal distribution with mean equal to 4.9 and standard deviation equal to 0.6.
Let X denote the acidity of rainfall.
We can draw a normal probability plot with given parameters using the Minitab.
Step to draw a normal probability plot using the Minitab:
-
Go the graph menu and click the probability distribution plots and select view single and click ok.
-
Select distribution Normal and enter the mean equal to 4.9 and standard deviation equal to 0.6.
-
Click ok and you will get the normal probability plot with the labelled mean and standard deviation.
-
Given below figure depicts the same.