Solution Found!
Connection Time A histogram of the connection time, in
Chapter 3, Problem 25E(choose chapter or problem)
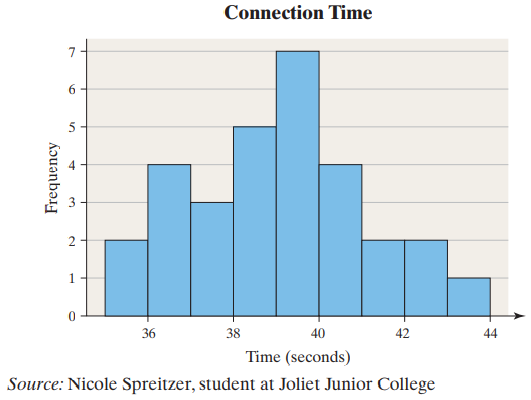
Connection Time A histogram of the connection time, in seconds, to an Internet service provider for 30 randomly selected connections is shown. The mean connection time is 39.007 seconds and the median connection time is 39.065 seconds. Identify the shape of the distribution. Which measure of central tendency better describes the “center” of the distribution?
Questions & Answers
QUESTION:
Connection Time A histogram of the connection time, in seconds, to an Internet service provider for 30 randomly selected connections is shown. The mean connection time is 39.007 seconds and the median connection time is 39.065 seconds. Identify the shape of the distribution. Which measure of central tendency better describes the “center” of the distribution?
ANSWER:
Solution:
Step 1 of 2:
The histogram of the connection time of an Internet service provider is given.
We have to identify the shape of the distribution.
We also have to determine which measure of central tendency better describes the center of the distribution.