HOW DO YOU SEE IT Using the graph, which value best approximates the area of the region
Chapter 5, Problem 52(choose chapter or problem)
Using the graph, which value best approximates the area of the region between the x-axis and the function over the interval \(\left[-\frac{1}{2}, \frac{1}{2}\right]\) ? Explain.
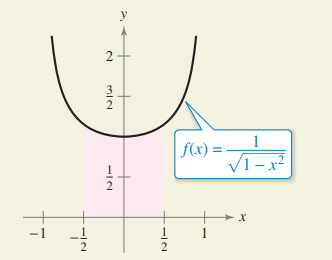
(a) -3
(b) \(\frac{1}{2}\)
(c) 1
(d) 2
(e) 4
Text Transcription:
[-frac 1 2, frac 1 2]
frac 1 2
Unfortunately, we don't have that question answered yet. But you can get it answered in just 5 hours by Logging in or Becoming a subscriber.
Becoming a subscriber
Or look for another answer