Solution Found!
(a) The correlation between number of married residents
Chapter 4, Problem 17RE(choose chapter or problem)
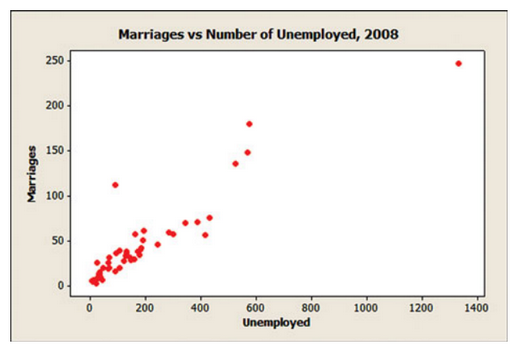
QUESTION: The correlation between number of married residents and number of unemployed residents in 2008 for the 50 states and Washington, DC, is 0.922. A scatter diagram
A lurking variable is in the relation presented in part (a). Use the following correlation matrix to explain how population is a lurking variable.

The correlation between unemployment rate (number unemployed divided by population size) and marriage rate (number married divided by population size) in 2008 for the 50 states and Washington, DC, is 0.050. A scatter diagram between unemployment rate and marriage rate drawn in MINITAB is shown next. What type of relation appears to exist between unemployment rate and marriage rate?

Write a few sentences to explain the danger in using correlation to conclude that a relation exists between two variables without considering lurking variables.
Questions & Answers
QUESTION: The correlation between number of married residents and number of unemployed residents in 2008 for the 50 states and Washington, DC, is 0.922. A scatter diagram
A lurking variable is in the relation presented in part (a). Use the following correlation matrix to explain how population is a lurking variable.
The correlation between unemployment rate (number unemployed divided by population size) and marriage rate (number married divided by population size) in 2008 for the 50 states and Washington, DC, is 0.050. A scatter diagram between unemployment rate and marriage rate drawn in MINITAB is shown next. What type of relation appears to exist between unemployment rate and marriage rate?
Write a few sentences to explain the danger in using correlation to conclude that a relation exists between two variables without considering lurking variables. ANSWER:
Solution:
Step 1 of 4:
(a)
Here we are given with a scatter plot of number of married residents and the number of unemployed residents.
Using the diagram we need to identify the type of relationship between the two variables.
The scatter plot is

From the diagram we can say that the two variables are positively correlated since the points in the scatter plot are increasing.
Thus, the two variables given are positively correlated.