Solution Found!

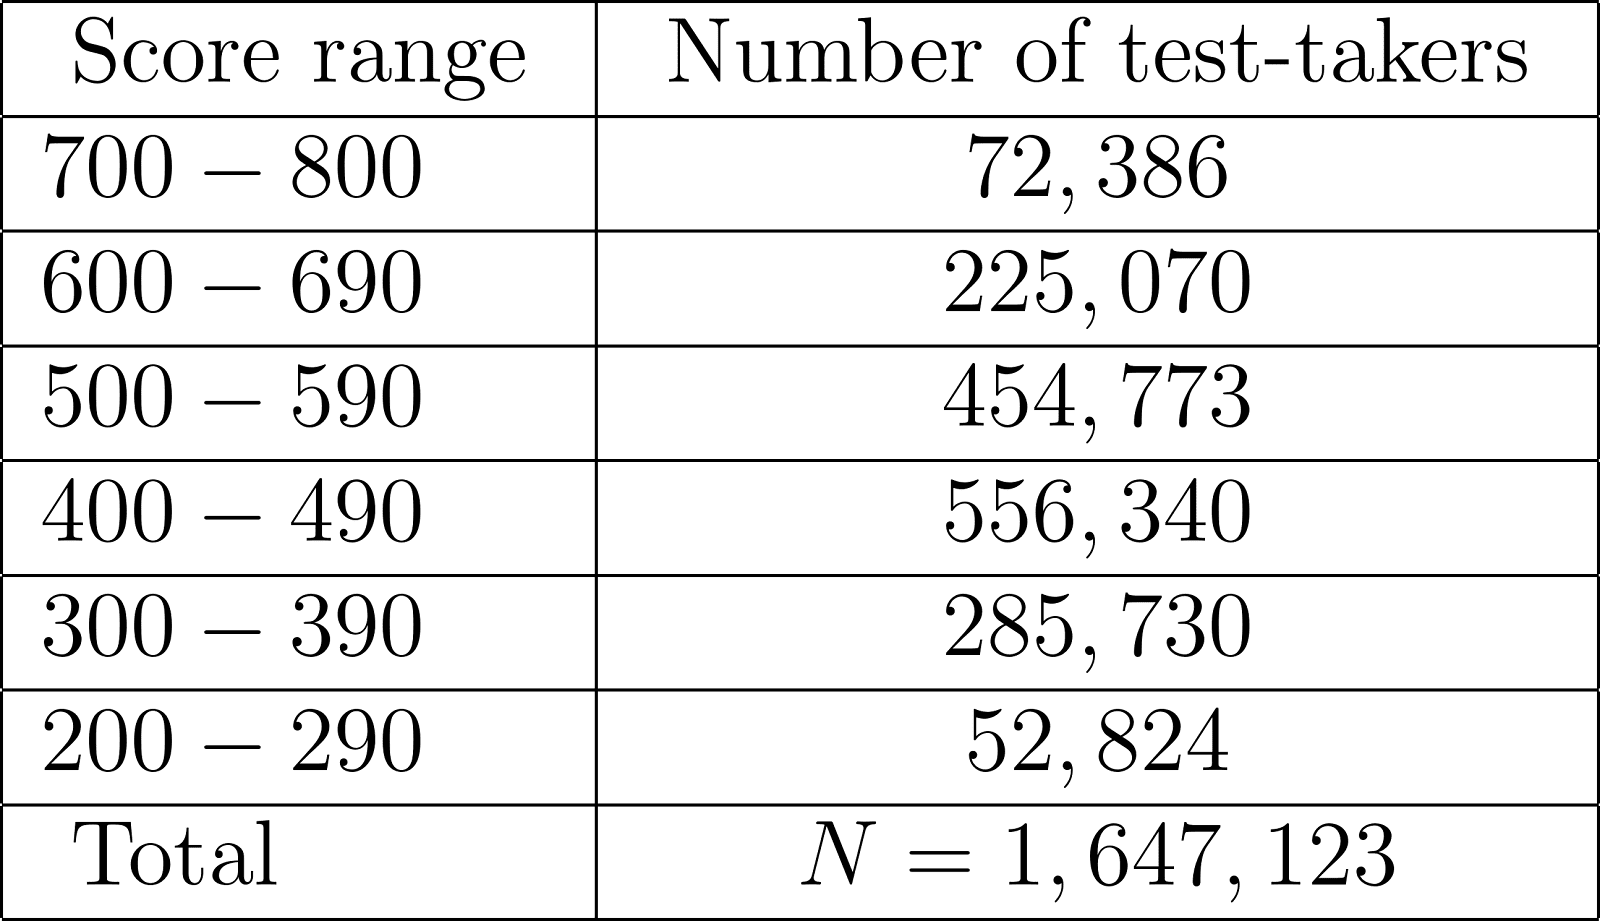
Table 15 shows the class interval frequencies for the 2011 Writing scores on the SAT
Chapter 15, Problem 16(choose chapter or problem)
QUESTION:
Table 15 shows the class interval frequencies for the 2011 Writing scores on the SAT. Draw a pie chart for the data in Table 15. Indicate the degree of the central angle for each wedge of the pie chart (rounded to the nearest degree).
Questions & Answers
QUESTION:
Table 15 shows the class interval frequencies for the 2011 Writing scores on the SAT. Draw a pie chart for the data in Table 15. Indicate the degree of the central angle for each wedge of the pie chart (rounded to the nearest degree).
ANSWER:Step 1 of 2
The class interval frequencies for the 2011 Writing scores on the SAT.