The input to the circuit shown in Figure SP 9-1 is the voltage of the voltage source
Chapter 9, Problem SP9-1(choose chapter or problem)
The input to the circuit shown in Figure SP 9-1 is the voltage of the voltage source, \(v_i\)(t). The output is the voltage across the capacitor, \(v_o\)(t). The input is the pulse signal specified graphically by the plot. Use PSpice to plot the output \(v_o\)(t) as a function of t for each of the following cases:
(a) C = 1 F, L = 0.25 H, \(R_1\) = \(R_2\) = 1.309 \(\Omega\)
(b) C = 1 F, L = 1 H, \(R_1\) = 3 \(\Omega\), \(R_2\) = 1 \(\Omega\)
(c) C = 0.125 F, L = 0.5 H, \(R_1\) = 1 \(\Omega\), \(R_2\) = 4 \(\Omega\)
Plot the output for these three cases on the same axis.
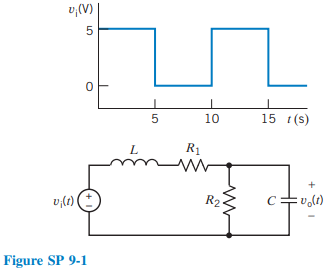
Hint: Represent the voltage source, using the PSpice part named VPULSE.
Unfortunately, we don't have that question answered yet. But you can get it answered in just 5 hours by Logging in or Becoming a subscriber.
Becoming a subscriber
Or look for another answer