PreparED Study Materials
STAT 285: Statistics for Business
School: Rutgers University
Number of Notes and Study Guides Available: 15
Notes
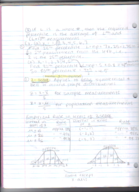
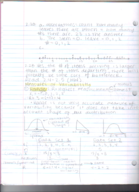
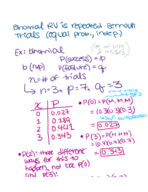





Study Guides


Videos
Cereal Box Weights: Z-Scores, Probabilities & Truth Behind Claims

Want To Learn More? To watch the entire video and ALL of the videos in the series:
full solution
Explore the intricacies of evaluating cereal box weights using Z-scores and normal distribution. By examining both individual boxes and a sample mean, understand the probabilities of achieving certain weight values. Gain insights into how statistical tools help interpret real-world product claims.
Brand X vs. Brand Y: 95% Confidence in Voltage Difference
Want To Learn More? To watch the entire video and ALL of the videos in the series:
full solution
Compare the voltages of Brand X and Brand Y batteries using statistical analysis. Learn how to determine a 95% confidence interval for their mean differences. Understand the process from data collection to interpretation of results.
Probabilities with Poisson Variables X1 & X2
Want To Learn More? To watch the entire video and ALL of the videos in the series:
full solution
Explore the complexities of two independent Poisson random variables, X1 and X2, with means ?1 = 2 and ?2 = 3. Understand the process of calculating specific event probabilities and the application of the Poisson formula. Key takeaways include the manipulation and interpretation of these statistical values.
Calcium in Chautauqua's Rain: 1990 vs. 2010 Analysis
Want To Learn More? To watch the entire video and ALL of the videos in the series:
full solution
Explore the calcium concentration in Chautauqua's rainwater from 2010, comparing it to 1990 levels. Using statistical tests, examine normal distribution and determine significant changes. The results provide insights into environmental shifts over two decades.
Calculating Mean & Modal Class for Million-Dollar Bonuses
Want To Learn More? To watch the entire video and ALL of the videos in the series:
full solution
Learn how to determine the mean and modal class for bonuses in millions. Understand midpoint calculations and how frequencies impact results. Gain insights into bonus distributions in the financial realm.
Testing the 123-Gallon Daily Water Claim: Fact or Fiction?
Want To Learn More? To watch the entire video and ALL of the videos in the series:
full solution
Explore the claim that average daily water consumption is 123 gallons. Using statistical testing, we evaluate a new sample against the Old Farmer’s Almanac claim. Learn how to interpret p-values and t-scores in hypothesis testing.